


Research & Insights

Learn more about compensation trends for legal and compliance professionals in India during FY 2023-24.
In the dynamic realms of law and compliance, the once-clear boundaries between in-house counsel and external legal counsel are becoming increasingly blurred. As organizations strive for greater efficiency, in-house legal departments are ambitiously taking on more work internally rather than outsourcing to external counsel. This paradigm shift not only represents a quest for cost-effectiveness but also signals a marked confidence in the capabilities of in-house teams and the strategic leverage they hold. This evolution in operational strategy is naturally mirrored in how in-house professionals are valued and compensated.
Entering the new fiscal year, businesses have started earmarking budgets for FY2024-25 with a keener eye on their in-house legal expenditure. The Vahura In-House Compensation Report - 2023-24 arrives at a timely juncture to serve as a beacon, guiding organizations through the intricacies of compensation trends that have emerged as a direct consequence of the expanding in-house mandate.
Our report delves into the nuances of remuneration across various hierarchical levels in the legal and compliance domains, offering a strategic tool that organizations can utilize to navigate the fiscal waters of the upcoming year with clarity and foresight.
The data for this report has been compiled by studying more than 250 data points:
The compensation tables in this report represent an estimated total compensation paid to professionals across levels in the legal, and compliance domains respectively. The industries vary across different sectors and there is healthy representation
Total compensation is defined as a combination of the annual fixed salary and annual variable bonus received by professionals from the employer. This does not include any joining or retention bonuses, ESOPs or any other additional benefits or emoluments that professionals may be entitled to as part of their overall remuneration.
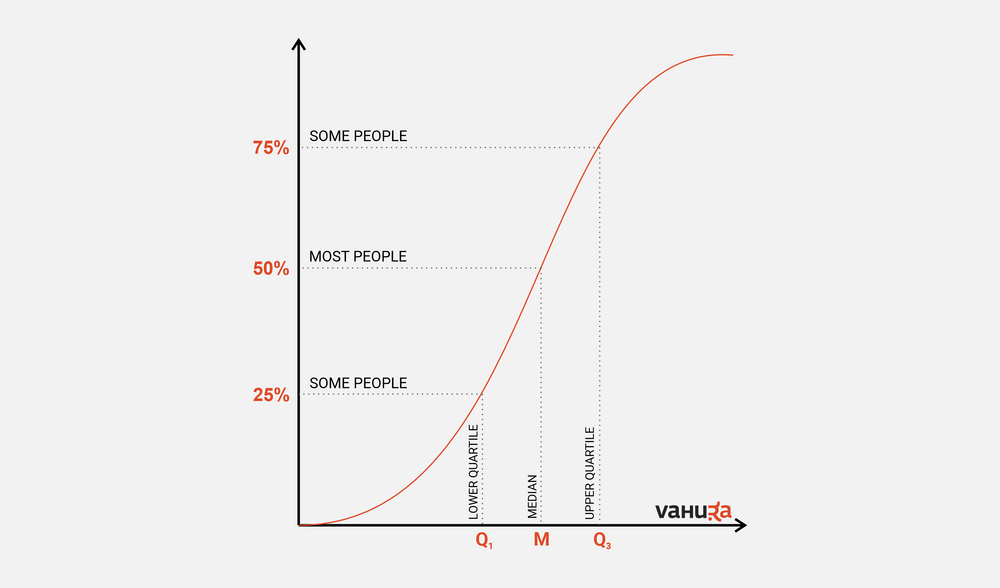
Q1 or The lower quartile is the value under which 25% of the compensation data points are found when they are arranged in increasing order.
Q2 or The median represents the value “in the middle” when the compensation data is arranged in increasing order. This implies that one-half of the professionals draw compensation above and the other half draw compensation below the median value provided.
Q3 or The upper quartile is the value under which 75% of the compensation data points are found when arranged in increasing order.
NOTE: This report is only intended to provide a general overview of the compensation ranges for professionals in in-house legal and compliance teams.
| PQE | Median - ₹ in Lacs | Median - $ in Thousand |
|---|---|---|
| 0-2 | 10.0 | 12.0 |
| 2-4 | 16.5 | 19.8 |
| 4-6 | 24.5 | 29.4 |
| 6-8 | 30.0 | 36.0 |
| 8-10 | 41.0 | 49.2 |
| 10-12 | 52.0 | 62.4 |
| 12-14 | 64.0 | 76.8 |
| 14+ | 80.0 | 96.0 |
| Range | ₹ in Lacs | $ in Thousand |
|---|---|---|
| Lower Quartile - Q1 | 92.6 | 112.8 |
| Median - Q2 | 158.7 | 192.7 |
| Upper Quartile - Q3 | 268.8+ | 326.3+ |
| PQE | Median - ₹ in Lacs | Median - $ in Thousand |
|---|---|---|
| 0-2 | 6.3 | 7.5 |
| 2-4 | 12.3 | 14.7 |
| 4-6 | 22.5 | 27.0 |
| 4-8 | 31.0 | 37.2 |
| 8-10 | 40.0 | 48.0 |
| 10-12 | 57.5 | 69.0 |
| Head of Compliance | 105.0 | 126.0 |
Bala is a solution architect, data analyst, and an MBA, who loves painting a picture using data. He leads a consulting practice that is at the cutting edge of legal market data, legal operating models, legal technology and innovation. Bala co-conceptualised and led the Vahura Best Law Firms to Work studies (2018 and 2022), and is a sought-after advisor on change management and innovation.