


Research & Insights

Learn more about compensation trends for legal and compliance professionals in India during FY 2022-2023.
In recent years, the role of professionals in the legal and compliance domains has grown in importance. Instead of just documentation and advisory, these roles are becoming more strategic. With technological advancements, legal departments are now more capable than ever of handling complex business requirements on a larger scale, thereby acting as business partners.
With the fiscal year coming to an end and organizations planning to begin the process of allocating budgets for FY 2023-2024, we hope that the Vahura Compensation Report 2023 provides clarity on compensation ranges across levels in the in-house legal and compliance domains.
The data for this report has been compiled by:
For this edition of the Vahura Compensation Report, we have considered a wider array of industry sectors in order to include a more comprehensive representation of the industry than in our previous compensation reports.
The compensation tables in this report represent an estimated total compensation paid to professionals across levels in the legal, and compliance domains respectively.
Total compensation is defined as a combination of the annual fixed salary and annual variable bonus received by professionals from the employer. This does not include any joining or retention bonuses, ESOPs or any other additional benefits or emoluments that professionals may be entitled to as part of their overall remuneration.
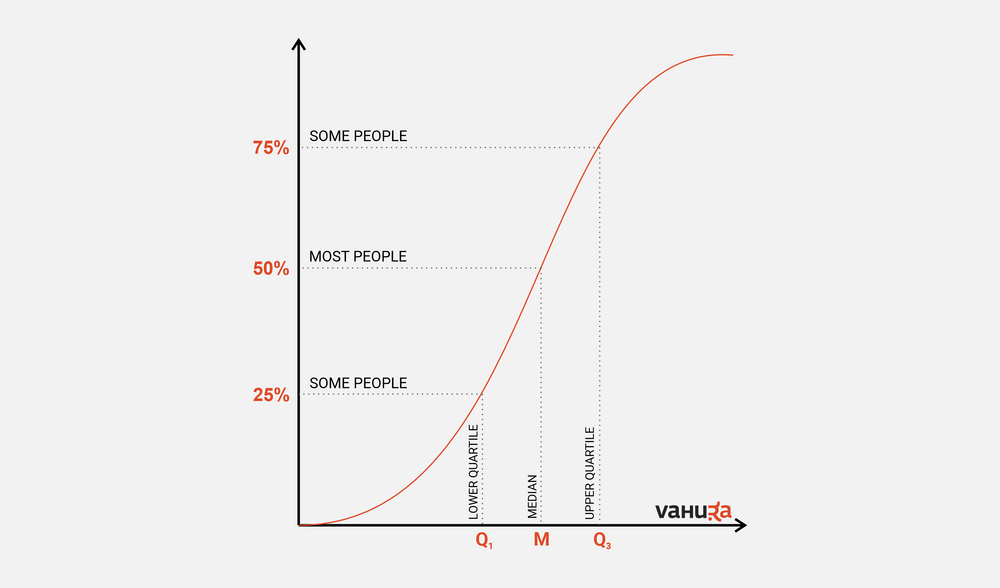
Q1 or The lower quartile is the value under which 25% of the compensation data points are found when they are arranged in increasing order.
Q2 or The median represents the value “in the middle” when the compensation data is arranged in increasing order. This implies that one-half of the professionals draw compensation above and the other half draw compensation below the median value provided.
Q3 or The upper quartile is the value under which 75% of the compensation data points are found when arranged in increasing order.
NOTE: This report is only intended to provide a general overview of the compensation ranges for professionals in in-house legal and compliance teams.
| PQE | Median - ₹ in Lacs | Median - $ in Thousand |
|---|---|---|
| 0-2 | 8.0 | 9.7 |
| 2-4 | 14.0 | 17.0 |
| 4-6 | 22.0 | 26.7 |
| 6-8 | 30.0 | 36.4 |
| 8-10 | 40.0 | 48.6 |
| 10-12 | 55.0 | 66.8 |
| Head - Legal | 80.0 | 97.1 |
| Range | ₹ in Lacs | $ in Thousand |
|---|---|---|
| Lower Quartile - Q1 | 92.6 | 112.8 |
| Median - Q2 | 158.7 | 192.7 |
| Upper Quartile - Q3 | 268.8+ | 326.3+ |
| PQE | Median - ₹ in Lacs | Median - $ in Thousand |
|---|---|---|
| 0-2 | 5.5 | 6.7 |
| 2-4 | 10.0 | 12.1 |
| 4-6 | 15.0 | 18.2 |
| 4-8 | 22.0 | 26.7 |
| 8-10 | 30.0 | 36.4 |
| 10-12 | 50.0 | 60.7 |
| Head - Compliance | 75.0 | 91.1 |
Bala is a solution architect, data analyst, and an MBA, who loves painting a picture using data. He leads a consulting practice that is at the cutting edge of legal market data, legal operating models, legal technology and innovation. Bala co-conceptualised and led the Vahura Best Law Firms to Work studies (2018 and 2022), and is a sought-after advisor on change management and innovation.